Contents
Scroll to:
https://doi.org/10.18087/cardio.2637
Scroll to:
Purpose: to study prognostic value of various biomarkers and their combinations in patients who survived decompensation of chronic heart failure.
Materials and methods. Patients (n=159) who were hospitalized with diagnosis of heart failure (HF) decompensation were included in a prospective single-center study. Examination on admission and the day of hospital discharge, included measurement of concentrations of N-terminal pro-brain natriuretic peptide (NT-proBNP), high-sensitivity troponin T (hsTnT), copeptin, soluble suppression of tumorigenicity 2 (sST2), kopetin, neutrophil gelatinase-associated lipocalin (NGAL), and galectin-3. Te combined primary endpoint comprised cardiovascular (CV) death, frst hospitalization because of HF heart failure decompensation, episodes of HF deterioration which required additional i/v diuretics, and CV death with successful resuscitation.
Results. During one-year follow-up 56 pts (35.2%) reached the combined primary endpoint. Tere were 78 (49.1%) cardiovascular events. During hospitalization, patients with the decompensation of heart failure experienced a decrease of sST2, NT-proBNP, galectin-3, kopetin, hsTnT and an insignifcant increase of NGAL. ROC analysis identifed signifcant relation between concentrations of NT-proBNP, sST2, copeptin and, to a lesser degree, hsTnT, determined at hospital discharge, and risk of combined primary endpoint during 1-year follow-up: area under the curve (AUC) was 0.733 [95% CI 0.645–0.820], p<0.0001, 0.772 [95% CI 0.688–0.856], p<0.0001, 0.735 [95% CI 0.640–0.830], p<0.0001, and 0.659 [95% CI 0.553–0.764], p=0.005, respectively. Patients who during hospitalization did not achieve cut-off values of NT-proBNP ≤1696 rg/ml, sST2≤37.8 hg/ml, copeptin≤28.31 rmol/L and hsTnT≤28.37 rg/ml, had higher risk of reaching adverse events during 1 year; OR and 95% CI were 2.96 [1.61, 5.42] p<0.0001, 4.31 [2.34, 7.93] p<0.0001, 3.06 [1.59, 5.89] and 2.19 [2.12, 4.27]), respectively. According to Cox regression analysis, risk of the combined primary end point was the highest in patients with 3 or more elevated markers (OR = 6.6 [3.584, 12.158], p<0.0001), average in patients with 2 elevated markers (OR = 1.123 [0.51, 2.48]), p=0.7), and the lowest in patients with no markers increase or increase of only one marker (OR = 0.11 [0.049, 0.241], p<0.0001). In the Kaplan-Mayer survival analysis all three groups were statistically different. In order to identify the most prognostically strong model, a reclassifcation analysis was performed. According to this analysis, the combination of sST2 and NT-proBNP concentrations determined at hospital discharge, exceeded one NT-proBNP (reclassifcation = –8.1%). At the same time, predictive value of only sST2 just insignifcantly less than value of sST2 and NT-proBNP combination (reclassifcation = –1.9%).
Conclusion. Patients with three and more elevated markers at hospital discharge have high risk of adverse events. Te biggest prognostic value has combination of sST2 and NT-proBNP concentrations. In order to determine the long-term prognosis of a patient with HF decompensation, it is sufcient to measure concentrations of sST2 and NT-proBNP at hospital discharge. Alternatively, it is possible to limit to sST2 only, which is just insignifcantly inferior to the sST2 and NT-proBNP combination. Patients with concentrations of sST2 ≥37.8 hg/ml and NT-proBNP ≥1696 rg/ml at hospital discharge have maximal 1year risk of death due to recurrent HF decompensation.
Protasov V.N., Narusov O.Yu., Skvortsov A.A., Protasova D.E., Kuznetsova T.V., Petrukhina A.A., Masenko V.P., Tereshchenko S.N. Multimarker Approach in Risk Stratification of Patients with Decompensated Heart Failure. Kardiologiia. 2019;59(1S):53-64. (In Russ.) https://doi.org/10.18087/cardio.2637
Heart failure (HF) is an important global healthcare issue [1—11]. According to the European Society of Cardiology, 1—2% of adult population in the developed countries suffer HF, and patients over 70 years old amount to 10% or more [8]. According to the Russian epidemiological study EPOCH-CHF, about 7% of the Russian population (7.9 million people) suffer chronic heart failure (CHF) [9].
Despite the significant progress in treatment achieved in the past 30 years, introduction of new products and technologies, death rate of CHF patients remains high: a 5-year survival rate is about 50% [5, 10, 11]. The highest risk of re-hospitalization and death from HF is observed in patients who had decompensated HF. According to different authors, annual death rate in this patient group ranges from 17.4% to 23.2% and reaches up to 29% when taking into account the hospital mortality [5, 10,11]. And the rate of re-hospitalization within the first 30 days after discharge is 20—25% [12]. The individualization of treatment requires accurate patient risk stratification with a view to timely implementation of necessary therapeutic activities. Clinical and instrumental risk factors, including high CHF functional class (FC), conventional laboratory parameters, low left ventricle ejection fraction (LVEF) are not sufficiently predictive [13-15]. Development of biomarker diagnosis significantly improved risk stratification and risk prognosis in HF patients. In recent years, a large number of new biomarkers other than natriuretic peptides was identified, which enhances considerably the risk stratification in CHF patients.
Several studies demonstrated that multimarker approach using various biomarker sets, which reflect different component of HF pathogenesis, might be more effective [16-19]. However, it remains unclear and requires further study as to which combination provides the most accurate prognosis of adverse outcomes [20].
The purpose of this study was to evaluate the prognostic value of new biomarkers and their combinations in patients with decompensated CHF.
Materials and methods
The study included 159 patients above 18 years old with severe decompensated HF FC III-IV and LVEF <40%, consecutively hospitalized from January 2012 to February 2015. Diagnosis and treatment of decompensated HF were carried out according to the current standards and guidelines [8, 21-23]. The study was approved by the Ethics Committee of A.L. Myasnikov Institute of Clinical Cardiology. All patients signed an informed consent form to be included in the study. Mean age of the patients was 63.1±11.4 years old. CHF was due to coronary heart disease (CHD) (59.1%), arterial hypertension and developing hypertensive heart disease (25.8%) and dilated cardiomyopathy (15.1%). LVEF decreased significantly in all patients included in the study (mean 28±6,2%). Characteristics of patients included in the study are detailed in Table 1.
Table 1. Baseline characteristics of patients (at admission)
Parameter | Value |
Age, years | 63.1±11.4 |
Male | 114 (71.6%) |
Etiology of CHF |
|
History |
|
Risk factors: |
|
Clinical and functional parameters |
|
Laboratory findings |
|
Treatment |
|
Data are provided as absolute number of patients (%), non-parametric data are provided as Me [25th percentile; 75th percentile] parametric — both M±SD; CABG — coronary artery bypass grafting; MRAs — mineralocorticoid receptor antagonists; ACE — angiotensin-converting enzyme; ARB — angiotensin II receptor blockers; DBP — diastolic blood pressure; DCM — dilated cardiomyopathy; CHD — coronary heart disease; ICD — implantable cardioverter defibrillator; EDV - end-diastolic volume; ESV — end-systolic volume; LV — left ventricle; CVA — cerebrovascular accident; SBP — systolic blood pressure; DM — diabetes mellitus; GFR — glomerular filtration rate; EF — ejection fraction; FC — functional class; AF — atrial fibrillation; CHF — chronic heart failure; PCI — percutaneous coronary intervention; SHOKS — Clinical Assessment Scale; NT-proBNP — N-terminal pro-brain natriuretic peptide.
The study was prospective and single-center. Patient examination with determination of concentrations of the panel of markers: N-terminal pro-brain natriuretic peptide (NT-proBNP), soluble Suppression of Tumorigenicity-2 (sST2), copeptin, high-sensitive cardiac troponin T (hs-cTnT), galectin-3 and neutrophil gelatinase–associated lipocalin (NGAL), was performed at baseline when patient was admitted to hospital and after compensation of HF symptoms at discharge. The follow-up period was 12 months after discharge.
The combined primary endpoint (CPE) comprised cardiovascular (CV) death, first re-hospitalization because of HF decompensation, episodes of HF deterioration which required additional i/v diuretics in the outpatient setting, and CV death with successful resuscitation.
Conventional clinical study was carried out to evaluate general condition, dyspnea, congestion, severity of edema syndrome, heart rate (HR) and blood pressure (BP), blood tests, electrocardiogram (ECG), chest X-ray.
CHF FC was determined by the classification of the Society of Heart Failure Specialists (2002). The 6-minute walking test was used for the more objective evaluation.
Transthoracic echocardiography with myocardial tissue Doppler was performed using Philips iE-33 ultrasound system, cardiac sensor with frequency range 1–5 MHz. LV systolic function was evaluated in two-dimensional mode by the method of discs. LV end-systolic volume (ESV) and end-diastolic volume (EDV), left atrial volume was determined in the apical four-chamber position. LVEF was assessed by Simpson's method. Parameters of transmitral diastolic flow (E/A), A-Ar, as well as deceleration time of early diastolic LV filling (DT) and isovolumic relaxation time (IVRT) were measured to evaluate diastolic function in the pulse Doppler mode. Motion rate of the fibrous ring was measured in the myocardial tissue Doppler mode and used for the assessment of LV filling pressure (E/e').
The following biomarker panels were performed in all patients: NT-proBNP, hs-cTnT, NGAL, copeptin, galectin-3, sST2. Blood was collected from the cubital vein in test tubes containing EDTA (as 2 mg/ml of blood), and conventional tubes with sedimentary granules depending on a biomarker. The tubes were centrifuged for 15 min at 2500 rpm and 4 ℃. Supernatant was dispensed in 500μL portions into individual Eppendorf microtubes, samples were frozen and stored at – 70 ℃.
Serum concentrations of NT-proBNP and hs-cTnT were determined by electrochemiluminescence (ECL) sandwich immunoassay using Elecsys 2010 analyzer (Roche, Switzerland) and appropriate proBNPII and TroponinThs systems (Roche). NT-proBNP measuring range: 5–35,000 pg/mL, troponin Т measuring range: 3–10,000 pg/mL (normal ≤3.0 pg/mL).
Copeptin concentration was determined by immunofluorescence analysis based on the TRACE (Time Resolved Amplified Cryptate Emission) technology using Kryptor Compact Plus analyzer (Brahms, Germany) and a reagent kit for the determination of C-terminal fragment of arginine vasopressin prohormone (CT-proAVP) — BRAHMS Copeptin K-050 (TermoFisherScientific, Germany). Measuring range: 4.8–1,200 pmol/L. Analytical sensitivity: 4.8 pmol/L.
Concentration of galectin-3 was determined by ELISA analysis. The technology was same as the method used for the evaluation of NGAL. We used HumanGalectin-3 PlatinumElisa kits (eBioscience, USA). Sensitivity of the test system was 0.12 ng/mL.
Concentration of soluble ST2-receptor was determined using ST2 enzyme immunoassay kit (Critical Diagnostics Presage®ST2 Assay; reference No. VS-1065E), which is based on a sandwich-type enzyme immunoassay as the biomarkers described above. This method is highly sensitive, ST2 measuring range: 2-200 ng/mL.
Serum concentration of NGAL was determined using BioVendorHumanLipocalin-2/NGAL ELISA kit. Sensitivity of this method was 0.02 ng/mL (range 0.3–10 ng/mL).
Statistical processing of data was carried out using SPSS Statistic 18 and Microsoft Excel software. Descriptive statistics of continuous quantitative variables after normality analysis is represented by mean value (M) and 95% confidence interval (95% CI) for normal distribution or by median (Me) and 25th and 75th percentiles [25th ; 75th] for abnormal distribution. Critical values of significance were 5%. Distribution was considered normal if Kolmogorov-Smirnov difference from the theoretical normal distribution was more than 0.05. Correlation analysis used Pearson's correlation coefficient for the parametric indicators; Spearman's coefficient for the nonparametric data. Analytical statistical processing was performed using paired and unpaired Student's t-test for quantitative data with normal distribution or Mann-Whitney-Wilcoxon rank sum test for quantitative data with distribution other than normal. Qualitative and ordinal variables were compared using the χ 2 criterion or Mann-Whitney-Wilcoxon rank sum test. Numerical value of probability (p) less than 0.05 (two-tailed significance test) demonstrated statistically significant differences. ROC-analysis provided marker concentration cut-offs and determined their sensitivity and specificity. Prognosis was assessed using regression analysis. Survival analysis and multivariate statistical processing were performed using Cox regression analysis and Kaplan-Meier method. Net reclassification indices were calculated using the following formula
NRI = NRIevent + NRInonevent, where NRIevent = P(up/event) — P(down/event); NRInonevent = P(down/nonevent) — P(up/nonevent) [24, 25].
Results
In 12-month follow-up period, 78 (49.1%) different CV complications were registered. 56 (35.2%) patients reached the study CPE. 25 (16.4%) patients died of CV complications; 1 case of clinical death with successful CPR was registered, a total of 47 (20.7%) re-hospitalizations for HF; 10 (6.2%) patients developed decompensation which required outpatient administration of intravenous diuretics. No patients were withdrawn for non-medical reasons; there were no protocol deviations.
Repeated decompensation or hospitalization due to HF/death from the CV complications was observed more in patients with initially more serious condition, higher CHF FC, higher score by Scale of Heart failure Optimizing Clinical Status (SHOCS), severe LV systolic dysfunction and increased LV volume, lower systolic BP and hemoglobin blood levels. These patients had significantly higher initial concentrations of the studied markers, received resynchronization therapy more often, underwent more implantations of different devices (pacemaker, implantable cardioverter defibrillator) and received digoxin therapy more than 3 times as often as the group of patients who didn’t reach CPE.
Change of marker concentration within the hospitalization period
The mean period of hospitalization was 13.4±2.12 days. At inclusion of patients in the study, concentrations of all the studied markers were high and remained increased after the HF symptom compensation at discharge from the hospital. Though, the active therapy significantly decreased the concentrations of NT-proBNP, galectin-3, hs-cTnT, copeptin, sST2. The biggest changes were observed in the concentrations of NT-proBNP, copeptin and sST2. At the same time, there was a trend to higher levels of NGAL, which is likely associated with the alterations in renal tubular epithelial cells on the active therapy consisting of high doses of loop diuretics and mineralocorticoid receptor blockers (Table 2).
Table 2. Dynamics of marker concentration in the study group within the hospitalization period
Marker | Baseline | Discharge | p | Δ, % |
NT-proBNP, pg/ml | 3615.5 [1578.0; 6289.3] | 2179.0 [995.4; 4383.0] | <0.0001 | –37.56±19.2 |
Galectin-3, ng/mL | 14.2±3.8 | 12.7±3.7 | <0.0001 | -12.97±11.4 |
Copeptin, pmol/L | 40.61 [29.1; 48.9] | 28.72 [20.0; 37.5] | <0.0001 | -25.9±18.2 |
sST2, ng/mL | 60.49 [41.9; 92.9] | 38.43 [24.7; 63.7] | <0.0001 | -29.9±19.9 |
NGAL, ng/mL | 62.35 [43.0; 87.5] | 72.05 [47.5; 98.2] | 0.077 | 8.19±28.7 |
hs-cTnT, pg/mL | 29.95 [21.8; 49.6] | 28.37 [21.3; 46.6] | <0.0001 | -10.61 [-19.71; -5.36] |
The correlation analysis showed that significant correlations between the levels of NT-proBNP and copeptin, hs-cTnT, sST2 (r=0.62; 0.31 and 0.49, respectively; p<0.01), copeptin and hs-cTnT, NGAL, sST2 (r=0.3; 0.37 and 0.51, respectively; p<0.01), copeptin and galectin-3 (r=0.25; p<0,05) were observed at admission. Interestingly, at discharge, there was a trend to weaker correlation between the levels of NT-proBNP and sST2 (r=0.4; p<0.01) and a trend to higher correlation coefficient between the levels of sST2 and hs-cTnT (r=0.38; p<0,01), sST2 and copeptin (r=0.53; p<0.01).
Evaluation of predictive value of markers
In order to determine a possible predictive value, all markers were tested by ROC-analysis, which revealed a significant relationship between adverse outcome and concentrations of NT-proBNP, copeptin, hs-cTnT and sST2. Moreover, concentrations of NT-proBNP, copeptin and sST2 determined after HF compensation had greater predictive power as compared to the concentrations of these markers at admission (Table 3).
Table 3. ROC data for marker concentrations at admission and discharge
Marker | AUC admission | 95% CI | p | AUC discharge | 95% CI | p |
NT-proBNP | 0.695 | 0.608 — 0.783 | <0.0001 | 0.733 | 0.645 — 0.820 | <0.0001 |
Copeptin | 0.677 | 0.575 — 0.778 | 0.002 | 0.735 | 0.640 — 0.830 | <0.0001 |
hs-cTnT | 0.663 | 0.567 — 0.758 | 0.001 | 0.659 | 0.553 — 0.764 | 0.005 |
sST2 | 0.704 | 0615 — 0.793 | <0.0001 | 0.772 | 0.688 — 0.856 | <0.0001 |
ROC-analysis and univariate Cox proportional analysis showed that the concentrations of NT-proBNP, copeptin, hs-cTnT and sST2 proved to be predictors of poor prognosis, unlike the concentrations of galectin-3 and NGAL, that were excluded from the further analysis. The risk of CPE development during a long-term patient follow-up after HF decompensation was significantly higher, if at discharge from the hospital, the patient had the following cut-off concentration values: sST2 ≥37,8 ng/mL (odds ratio — OR 4.31 with 95% confidence interval — 95% CI 2.34–7.93; p<0.0001) copeptin ≥28,31 pmol/L (OR 3.06, 95% CI 1.59–5.89; p<0,0001), NT-proBNP ≥1696 pg/mL (OR 2.96, 95% CI 1.61–5.42; p<0.0001) and hs-cTnT ≥28,37 pg/mL (OR 2.19, 95% CI 2.12–4.27) (Table 4).
Table 4. Biomarkers as predictors of a poor long-term prognosis (univariate Cox proportional analysis)
Factor | Cut-off | OR | 95% CI | p |
NT-proBNP | 1696 pg/mL | 2.96 | 1.61 — 5.42 | <0.0001 |
Copeptin | 28.31 pmol/L | 3.06 | 1.59 — 5.89 | <0.0001 |
hs-cTnT | 28,37 pg/mL | 2.19 | 2.12 — 4.27 | 0.014 |
sST2 | 37,8 ng/mL | 4.31 | 2.34 — 7.93 | <0.0001 |
There were no significant differences in the predictive value between the models comprising sST2, NT-proBNP, copeptin, though, this indicator trended to an increase when sST2 was used. hs-cTnT had less power of predicting CPE as compared to these three markers. We have provided the detailed analysis of these data earlier [26-28].
Multimarker approach to the long-term risk stratification in patients with acute decompensated HF (ADHF)
Later we attempted to stratify the risk in patients, based only on the concentrations of 4 markers, determined at discharge and possessing predictive value, according to the performed analysis (NT-proBNP, copeptin, sST2 and hs-cTnT). The biomarker level was considered elevated, if it was higher the corresponding cut-off value.
Based on this parameter, all patients were divided into 5 groups (0 to 4) according to the number of elevated biomarkers. Univariate Cox regression analysis showed an increase in OR depending on the number of markers put in the model. It was minimal (OR 0.145, 95% CI 0.045–0.464; p=0.001) in Group 0 that included patients who reached reduction in the concentration of all four markers below the threshold levels during the hospitalization; and Group 4 had the highest OR (3.416, 95% CI 1.921–6.076; p<0.0001]) of CPE development (Table 5).
Table 5. Long-term risk of adverse outcomes depending on a group of increased markers (Cox regression analysis)
Group | OR | 95% CI | p |
0 | 0.145 | 0.045 — 0.464 | 0.001 |
1 | 0.193 | 0.070 — 0.533 | 0.002 |
2 | 1.235 | 0.584 — 2.610 | 0.5 |
3 | 2.987 | 1.755 — 5.085 | <0.0001 |
4 | 3.416 | 1.921 — 6.076 | <0.0001 |
Thus, the more biomarkers above the cut-off concentration values are identified in ADHF patients at discharge, the higher is the long-term risk of CV complications.
The Kaplan-Meier analysis revealed a regular divergence of survival curves in all 5 groups of patients, however, interestingly, the curves of Groups 0 and 1, as well as Groups 4 and 5, didn’t have any statistically significant differences (Fig. 1).
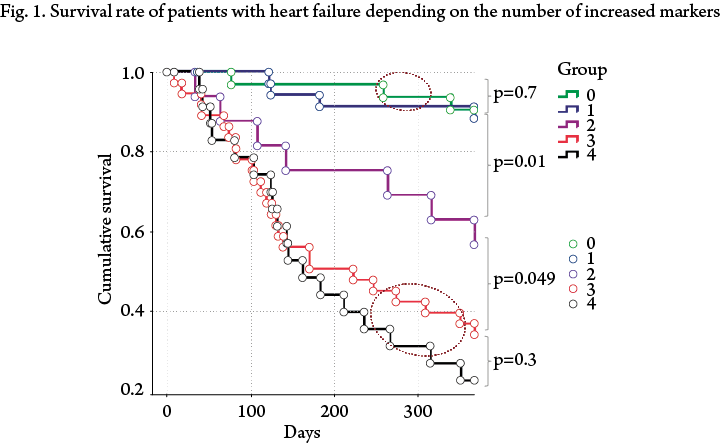
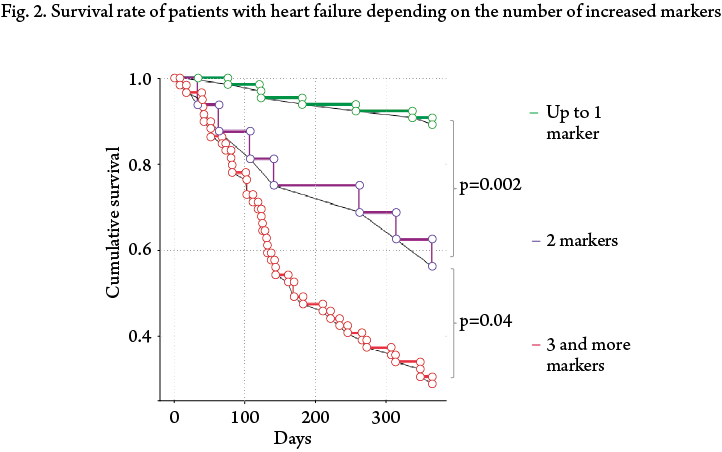
Given the absence of statistically significant differences between these groups, we redistributed patients in three groups. Group 1 included patients who reached the reduction of concentrations of the analyzed markers below the cut-off values at discharge from the hospital or who had a concentration value above the cut-off level of only one marker. OR of CPE development in this group was minimal — 0.11 (95% CI: 0.049–0.241; p<0.0001). Group 2 consisted of patients who had an increased concentration above a certain level of any two markers (OR 1.123, 95% CI 0.51–2.48; p=0.7). Group 3 included patients who had any 3 or more markers above the cut-off values at discharge from the hospital. This group had the highest odds ratio of the adverse outcome development within the follow-up year (6.6, 95% CI 3.584–12.158; p<0.0001).
In the Kaplan-Mayer survival analysis, the difference between all three groups was statistically significant.
Reclassification
As it was demonstrated, three or more markers above the cut-off values at discharge from the hospital indicate that a patient has an extremely poor prognosis after ADHF. However, in clinical practice, using a large number of markers is challenging. In this regard, in order to cut the marker panel to an effective minimum, we performed an additional analysis aimed at identifying the strongest combination for the risk stratification including not more than 2 markers. Considering the previously obtained data, NT-proBNP, sST2 and copeptin were selected for this analysis as the most reliable risk predictors in our study. Marker concentrations measured at discharge were used. To identify possible differences in potential models by direct comparisons and quantification, we used the reclassification analysis.
Reclassification is used to identify advantages in the stratification of a "new" test as compared to the "old" one [24]. Residual reclassification index was calculated according to a method based on the comparison of two conditional tests taking into account positive and negative predictive value of two models being compared. Residual reclassification index has a positive value if a new model provides correct reclassification of patients as compared with an old model, i.e. patients at high risk are included in the high risk group and patients at low risk — in the low risk group; a negative value shows that the new model incorrectly stratifies patients at high risk to the low-risk group, and index of 0 means that the "new" model isn’t superior to the "old” one.
The analysis showed that the combination of sST2 and NT-proBNP values, determined at the patient's discharge from the hospital, has the biggest predictive power. This model is significantly more superior to individual copeptin and combination of copeptin values with sST2 or NT-proBNP — reclassification was 5.9% and 7.3%, respectively. It is important that the combination of copeptin with sST2 or NT-proBNP values did not increase, but reduced the predictive value of the initial model, and only the concentration values of sST2 determined at discharge stratified the risk of patients after ADHF more precisely. Moreover, the model including only the sST2 concentrations values was almost as effective as the combination of NT-proBNP+sST2 markers (reclassification –1.9%), while for the model with the NT-proBNP concentration values, reclassification was –8.1 % as compared with the initial combination (Table 6).
Table 6. Reclassification
“New” model | “Old” model | Reclassification, % |
sST2 | Copeptin | 9.2 |
ΔsST2 | Copeptin | 8.5 |
NT-proBNP+sST2 | Copeptin | 12.3 |
sST2+ΔsST2 | Copeptin | 19.8 |
sST2+ΔsST2 | NT-proBNP+sST2 | -6.1 |
sST2 | NT-proBNP+sST2 | -1.9 |
sST2 | Copeptin+sST2 | 2.6 |
sST2 | Copeptin+NT-proBNP | 2.3 |
NT-proBNP+sST2 | Copeptin+sST2 | 5.9 |
NT-proBNP+sST2 | Copeptin+NT-proBNP | 7.3 |
NT-proBNP | NT-proBNP+sST2 | -8.1 |
NT-proBNP+sST2 at discharge | NT-proBNP+sST2 at admission | 18 |
In addition, we compared the most informative model NT-proBNP+sST2 (concentrations of relative markers were determined at discharge) with the same combination determined at admission. The analysis confirmed the advantage of using these markers at discharge — significant reclassification of 18%.
Discussion
Our study was aimed at searching for the new possibilities in risk stratification and prognosis assessment in patients after HF decompensation. Thus, we studied new biomarkers of HF, used various analysis options for risk stratification in patients after ADHF. This study has certain characteristics, which make it possible to test the range of included markers. First, only patients with previously diagnosed decompensated HF were included, and patients with a de novo clinical picture of HF were excluded. Second, all patients had significantly reduced LV systolic function, indicating a high risk of CV complications development within the first year after discharge them from the hospital. Finally, concentration of the biomarkers were determined twice during the hospitalization: at admission and at discharge.
We have detailed the analysis of data on the predictive value of several biomarkers and their combinations [26-28]. The concentrations of sST2, NT-proBNP and copeptin determined after the compensation were most informative, as well as the degree of reduction of sST2 levels during the hospitalization (ΔsST2). It is important to emphasize that, despite the lack of significant differences in the predictive value of these indicators, using concentration of sST2, including in combination with NT-proBNP or ΔsST2, seemed to be most promising.
The multimarker approach to risk stratification and prognosis assessment in patients with HF is of high current interest and is studied extensively owing to the potential advantages over the currently available models of prognosis assessment. MARKED (Multi mARKer Emergency Dyspnea) study [29] using a broad marker panel (high-sensitivity C-reactive protein, hs-cTnT, cystatin C, NT-proBNP, galectin-3) was first to demonstrate that the increased numbers of elevated markers were accompanied by the progressive rise in short- and mid-term mortality from cardiovascular causes.
In this study, we used a different marker panel, and patient population also differed from that of the above study. Nevertheless, as a result the same trends was observed: progressive growth of OR depending on the number of indicators above the cut-off concentrations of the biomarkers studied. Thus, the multimarker strategy provides a sufficiently precise prognosis in patients with HF. However, in practice, using a large number of markers is impossible. Therefore, determining a maximum of 2 markers allowing the most accurate risk stratification in patients with CHF seems to be reasonable.
In this study, we used a reclassification method to directly compare the predictive power of different models. The study results show a great potential of sST2 in risk stratification in patients with CHF who suffered decompensation. The predictive capability of sST2 was found not to be inferior, but superior to traditional risk markers, including NT-proBNP, in patients with decompensated HF. The combination sST2 and NT-proBNP concentrations determined at of discharge from the hospital appeared to be most informative with regard to the risk of CPE development. However, as compared to NT-proBNP, isolated sST2 is only slightly inferior to this combination — the reclassification was only –1.9%. Thus, it's addition of sST2 to NT-proBNP, but not vice versa, significantly increases the predictive value of the model (reclassification when comparing NT-proBNP and NT-proBNP+sST2 was –8.1%).
How can we explain the superiority of sST2 over other markers? ST2 is a member of interleukin-1 receptor family and is represented by two isoforms — soluble (sST2) and membrane-bound forms of the receptor (ST2L). ST2 ligand is a cytokine interleukin-33 (IL-33), which produces cardioprotective effect by binding to ST2L, thus preventing myocardial hypertrophy and fibrosis, and eventually, cardiac remodeling [30-32]. sST2 in its turn is a trap for IL-33 and inhibits its interaction with ST2L and subsequent cardioprotection. Currently, two sources sST2 are known — cardiomyocytes secreting sST2 in response to the biomechanical overload [32, 33] and vascular endothelial cells [34]. At the moment of HF decompensation, the first mechanism may predominate, which explains the close correlation of sST2 and NT-proBNP concentrations at admission to the hospital. When compensation is achieved, LV filling pressure, being a sST2 synthesis stimulus, decreases, which is accompanied by reducing the correlation power of these two biomarkers. Thus, sST2 concentration determined at discharge integrally reflects the degree of "tension” of several key pathways in HF pathogenesis, such as fibrosis, inflammation, and myocardial stress [33, 35]. This favorably distinguishes it from the NT-proBNP, which is now a "gold standard” in HF diagnosis and patient risk stratification, and increased concentration of sST2 has an adverse clinical and predictive effect [36-40]. Thus, sST2 can be characterized as a more complicated "model" reflecting HF course in an individual patient and be widely applied as a precise tool for risk stratification in patients with HF. An important advantage of sST2 over NT-proBNP is that it is less dependent on patient's age, body mass index, and concomitant diseases, above all kidney dysfunction, as well as moderate biological and individual variability [41-44]. All the above explains the lack of significant improvement of the predictive model by adding a natriuretic peptide to sST2.
Our results generally agree with those of some other studies demonstrating that sST2 concentration is an independent predictor of a poor prognosis in both acute and stable HF [36-40, 45]. A. Aimo et al. carried out meta-analysis of 10 studies of acute HF, which demonstrated that sST2 concentration determined both at admission and at discharge is predictive with regard to death from all causes, cardiovascular death and combined endpoint (death from all causes and re-hospitalization due to HF). At the same time, only sST2 value determined at discharge was predictive of re-hospitalization due to HF [38]. It should be noted that when comparing findings of our study and the meta-analysis, it must be taken into account that some of the studies included in the meta-analysis were very heterogeneous — median LVEF was 40% or more (max 57%) in 6 studies, i.e. patients with both reduced and preserved EF were included, a large number of patients had de novo HF, which could not but affect the results.
The analysis carried out in the larger PARADIGM-HF project, which included 2002 patients with stable CHF, detected a linear and independent relationship of baseline sST2 levels with disease outcome. The increased level of sST2 at month 1 was associated with poor prognosis, and its decrease — with better prognosis [45].
Finally, the TRIUMPH study, which included nearly 500 patients with acute HF, demonstrated not only that concentration of sST2, determined at baseline and especially repeatedly, was a predictor of CPE onset (death from all causes and re-hospitalization), but also that level of the marker increases several weeks before the event. [46] Thus, using sST2 for treatment effectiveness control, as well as risk stratification in HF patients, is quite promising.
Conclusion
The results of the study performed using multimarker approach to the risk stratification in patients with acute decompensated heart failure show, that if at discharge from the hospital, a patient has 3 or more markers above the cut-off values, there is an extremely high risk of adverse outcomes within one year of follow-up. It is obvious, that this approach requires further study, accumulation of scientific data to determine a role of the multimarker approach in patients with heart failure. High cost of this approach is an important limiting factor.
The use of 1–2 markers with the maximum predictive value is the most clinically reasonable approach, thus avoiding loss of the stratification precision. The analysis of the strongest predictor markers performed in this study, including the reclassification, showed that a combination of sST2 and NT-proBNP determined at discharge from the hospital has the highest predictive value.
At the same time, in this study, sST2 was the most valuable biomarker for the risk stratification in patients with acute decompensated heart failure and was minimally inferior in this respect to the combination of sST2 and NT-proBNP.
It is important that this marker allows, both independently and as a part of multivariate models, predicting the onset of a study CPE, unlike copeptin, which demonstrated predictive capability comparable to NT-proBNP in the univariate analysis, however in the multivariate model, decreased rather than increased the value of these models for the risk stratification.
Thus, the combination of sST2 and NT-proBNP values or sST2 concentrations alone determined at discharge from the hospital must be used for the risk stratification in patients with decompensation of chronic HF, which is the main conclusion of our study. The greatest risk of the development of a combined end point is borne by patients with the biomarker levels exceeding the cut-off values: 37.8 ng/mL for ST2 and 1696 pg/mL for NT-proBNP.
Data are provided as absolute number of patients (%), non-parametric data are provided as Me [25th percentile; 75th percentile] parametric — both M±SD; CABG — coronary artery bypass grafting; MRAs — mineralocorticoid receptor antagonists; ACE — angiotensin-converting enzyme; ARB — angiotensin II receptor blockers; DBP — diastolic blood pressure; DCM — dilated cardiomyopathy; CHD — coronary heart disease; ICD — implantable cardioverter defibrillator; EDV - end-diastolic volume; ESV — end-systolic volume; LV — left ventricle; CVA — cerebrovascular accident; SBP — systolic blood pressure; DM — diabetes mellitus; GFR — glomerular filtration rate; EF — ejection fraction; FC — functional class; AF — atrial fibrillation; CHF — chronic heart failure; PCI — percutaneous coronary intervention; SHOKS — Clinical Assessment Scale; NT-proBNP — N-terminal pro-brain natriuretic peptide.
1. Roger V.L., Go A.S., Lloyd-Jones D.M. et al. Executive Summary: Heart Disease and Stroke Statistics – 2012 Update A Report from the American Heart Association. Circulation 2012;125:188–197. DOI: 10.1161/CIR.0b013e3182456d46
2. Lloyd-Jones D., Adams R.J., Brown T.M. et al. Executive summary: heart disease and stroke statistics – 2010 update: a report from the American Heart Association. Circulation 2010 Feb 23;121(7):948– 954. DOI: 10.1161/CIRCULATIONAHA.109.192666
3. Blecker S., Paul M., Taksler G. et al. Heart failure-associated hospitalizations in the United States. J Am Coll Cardiol 2013;61(12):1259– 1267. DOI: 10.1016/j.jacc.2012.12.038
4. Heidenreich P.A., Albert N.M., Allen L.A. et al. Forecasting the impact of heart failure in the United States: a policy statement from the American Heart Association. Circ Heart Fail 2013;6(3):606–619. DOI: 10.1161/HHF.0b013e318291329a
5. Maggioni A.P., Dahlström U., Filippatos G. et al. EURObservational Research Programme: regional differences and 1-year follow-up results of the Heart Failure Pilot Survey (ESC-HF Pilot). Eur J Heart Fail 2013;15(7):808–817. DOI: 10.1093/eurjhf/hf050
6. Roger V.L., Weston S.A., Redfeld M.M. et al. Trends in heart failure incidence and survival in a community-based population. JAMA 2004;292(3):344–350. DOI: 10.1001/jama.292.3.344
7. D. Levy, S. Kenchaiah, M. G. Larson et al. Long-term trends in the incidence of and survival with heart failure. N Engl J Med 2002;347(18):1397–1402. DOI: 10.1056/NEJMoa020265
8. P. Ponikowski, A. A Voors, S. D Anker et al. 2016 ESC Guidelines for the diagnosis and treatment of acute and chronic heart failure: Te Task Force for the diagnosis and treatment of acute and chronic heart failure of the European Society of Cardiology (ESC). Eur Heart J 2016;37(27):2129–2200. htps://doi.org/10.1093/eurheartj/ehw128
9. Fomin I.V., Belenkov Ju.N., Mareev V.Ju. et al. Chronic heart failure prevalence in European part of Russian Federation – results of JePOHA-CHF. Russian Heart Failure Journal 2006;7(1):4– 7. Russian
10. Harjola V.P., Follath F., Nieminen M.S. et al. Characteristics, outcomes, and predictors of mortality at 3 months and 1 year in patients hospitalized for acute heart failure. Eur J Heart Fail 2010;12(3):239– 248. DOI: 10.1093/eurjhf/hfq002
11. Maggioni A.P., Dahlström U., Filippatos G. et al; Heart Failure Association of ESC (HFA). EURObservational Research Programme: the Heart Failure Pilot Survey (ESC-HF Pilot). Eur J Heart Fail 2010;12:1076–1084. DOI: 10.1093/eurjhf/hfq154
12. Krumholz H.M., Merrill A.R., Schone E.M. et al. Paterns of hospital performance in acute myocardial infarction and heart failure 30-day mortality and readmission. Circ Cardiovasc Qual Outcomes 2009;5:407–413. DOI: 10.1161/CIRCOUTCOMES.109.883256
13. Pocock S.J., Wang D., Pfeffer M.A. et al. Predictors of mortality and morbidity in patients with chronic heart failure. Eur Heart J 2006;27:65–75. DOI: 10.1093/eurheartj/ehi555
14. W. C. Levy, D. Mozaffarian, D. T. Linker et al. Te Seatle Heart Failure Model: prediction of survival in heart failure. Circulation 2006;113:1424–1433. DOI: 10.1161/CIRCULATIONAHA.105.584102
15. Bouvy M., Heerdink E.R., Leufens H.G., Hoes A.W. Predicting mortality in patients with heart failure: a pragmatic approach. Heart 2003;89:605–609. PMID: 12748212
16. Maisel A., Mueller C., Adams K. Jr et al. State of the art: using natriuretic peptide levels in clinical practice. Eur J Heart Fail 2008;10:824– 839. DOI: 10.1016/j.ejheart.2008.07.014.
17. Zairis M.N., Tsiaousis G.Z., Georgilas A.T. et al. Multimarker strategy for the prediction of 31 days cardiac death in patients with acutely decompensated chronic heart failure. Int J Cardiol 2010;141:284–290. DOI: 10.1016/j.ijcard.2008.12.017.
18. Lassus J., Gayat E., Mueller C. et al. Incremental value of biomarkers to clinical variables for mortality prediction in acutely decompensated heart failure: the Multinational Observational Cohort on Acute Heart Failure (MOCA) study. Int J Cardiol 2013;168:2186–2194. DOI: 10.1016/j.ijcard.2013.01.228.
19. Ishii J., Nomura M., Nakamura Y. et al. Risk stratifcation using a combination of cardiac troponin T and brain natriuretic peptide in patients hospitalized for worsening chronic heart failure. Am J Cardiol 2002;89:691–695.
20. Chow S.L., Maisel A.S., Anand I. et al. Role of Biomarkers for the Prevention, Assessment, and Management of Heart Failure. A Scientific Statement From the American Heart Association. Circulation 2017;135:e1054–e1091. DOI: 10.1161/CIR.0000000000000490
21. Tereschenko S.N., Zhirov I.V., Narusov O.Yu. et al. Clinical guidelines for the diagnosis and treatment of chronic and acute heart failure. Kardiologicheskii Vestnik 2016;2:3–33. Russian
22. Mareev V.Yu., Ageev F.T., Arutyunov G.P. et al. National clinical guidelines (OSSN, RKO, RNMOT) on diagnostics and treatment of chronic heart failure (4th edition). Russian Heart Failure Journal 2013;81(7):379–472. Russian
23. Yancy C.W., Jessup M., Bozkurt B. et al. 2013 ACCF/AHA guideline for the management of heart failure: a report of the American College of Cardiology Foundation/American Heart Association Task Force on Practice Guidelines. J Am Coll Cardiol 2013;62(16):147–239. DOI: 10.1016/j.jacc.2013.05.019
24. Leening M.J., Vedder M.M., Witeman J.C. et al. Net reclassifcation improvement: computation, interpretation, and controversies: a literature review and clinician’s guide. Ann Intern Med 2014;160(2):122–131.
25. Pepe M.S. Problems with risk reclassifcation methods for evaluating prediction models. Am J Epidemiol 2011;173(11):1327–1335. DOI: 10.7326/M13-1522
26. Skvortsov A.A., Protasov V.N., Narusov O.Yu. et al. Supression of tumorogenicity 2 increases opportunities in patients long-term risk stratifcation afer acute heart failure decompensation. Kardiologiya 2017;57(1):48–58. DOI: 10.18565/cardio.2017.1.48-58. Russian
27. Skvortsov A.A., Protasov V.N., Narusov O.Yu. et al. Head to Head Comparison of Suppression of Tumorogenicity 2 and Copeptin Signifcance for Prognosis of Patients Afer Acute Heart Failure Decompensation. Kardiologiya 2017;57(9):21–33. DOI: 10.18087/cardio.2017.9.10028. Russian
28. Protasov V.N., Skvortsov A.A., Narusov O.Yu. et al. Supression of tumorogenicity 2 signifcance in patients with heart failure decompensation. Russian Heart Failure Journal 2017;18(4):279–289. DOI:10.18087/rhf.2017.4.2370. Russian
29. Eurlings L.W., Sanders-van Wijk S., van Kimmenade R. et al. Multimarker Strategy for Short-Term Risk Assessment in Patients With Dyspnea in the Emergency Department. J Am Coll Cardiol 2012;60:1668– 1677. DOI: 10.1016/j.jacc.2012.06.040
30. Schmitz J., Owyang A., Oldham E. et al. IL-33, an interleukin-1-like cytokine that signals via the IL-1 receptor-related protein ST2 and induces T helper type 2-associated cytokines. Immunity 2005;23:479– 490. DOI: 10.1016/j.immuni.2005.09.015
31. Kakkar R., Lee R.T. Te IL-33/ST2 pathway: therapeutic target and novel biomarker. Nat Rev Drug Discov 2008;7:827–840. DOI: 10.1038/nrd2660
32. Sanada S., Hakuno D., Higgins L.J. et al. IL-33 and ST2 comprise a critical biomechanically induced and cardioprotective signaling system. J Clin Invest 2007;117:1538–1549. DOI: 10.1172/JCI30634
33. Weinberg E.O., Shimpo M., De Keulenaer G.W. et al. Expression and regulation of ST2, an interleukin-1 receptor family member, in cardiomyocytes and myocardial infarction. Circulation 2002;106:2961– 2966. DOI: 10.1161/01.CIR.0000038705.69871.D9
34. Bartunek J., Delrue L., Van Durme F. et al. Nonmyocardial production of ST2 protein in human hypertrophy and failure is related to diastolic load. J Am Coll Cardiol 2008;52:2166–2174. DOI: 10.1016/j.jacc.2008.09.027
35. Chackerian A.A., Oldham E.R., Murphy E.E. et al. IL-1 receptor accessory protein and ST2 comprise the IL-33 receptor complex. J Immunol 2007;179:2551–2555. DOI: 10.4049/jimmunol.179.4.2551
36. Manzano-Fernandez S., Mueller T., Pascual-Figal D. et al. Usefulness of soluble concentrations of interleukin family member ST2 as predictor of mortality in patients with acutely decompensated heart failure relative to lef ventricular ejection fraction. Am J Cardiol 2011;107:259–267. DOI: 10.1016/j.amjcard.2010.09.011
37. Ky B., French B., McCloskey K. et al. High-sensitivity ST2 for prediction of adverse outcomes in chronic heart failure. Circ Heart Fail 2011;4:180–187. DOI: 10.1161/CIRCHEARTFAILURE.110.958223
38. Aimo A., Vergaro G., Passino C. et al. Prognostic value of soluble suppression of tumorigenicity-2 in chronic heart failure: a metaanalysis. J Am Coll Cardiol HF 2017;5:280–286. DOI: 10.1016/j.jchf.2016.09.010
39. Shah R.V., Chen-Tournoux A.A., Picard M.H. et al. Serum levels of the interleukin-1 receptor family member ST2, cardiac structure and function, and long-term mortality in patients with acute dyspnea. Circ Heart Fail 2009;2:311–319. DOI: 10.1161/CIRCHEARTFAILURE.108.833707
40. Rehman S.U., Mueller T., Januzzi J.L. Jr. Characteristics of the novel interleukin family biomarker ST2 in patients with acute heart failure. JACC 2008;52:1458–1465. DOI: 10.1016/j.jacc.2008.07.042
41. Kim M.S., Jeong T.D., Han S.B. et al. Role of Soluble ST2 as a Prognostic Marker in Patients with Acute Heart Failure and Renal Insuffciency. J Korean Med Sci 2015;30(5):569–575. DOI: 10.3346/jkms.2015.30.5.569.
42. Dieplinger B., Januzzi J.L. Jr, Steinmair M. et al. Analytical and clinical evaluation of a novel highsensitivity assay for measurement of soluble ST2 in human plasma — the Presage ST2 assay. Clin Chim Acta 2009;409:33–40. DOI: 10.1016/j.cca.2009.08.010
43. Mueller T., Zimmermann M., Dieplinger B. et al. Comparison of plasma concentrations of soluble ST2 measured by three different commercially available assays: the MBL ST2 assay, the Presage ST2 assay, and the R&D ST2 assay. Clin Chim Acta 2012;413:1493–1494. DOI: 10.1016/j.cca.2012.06.021
44. Wu A.H.B., Wians F., Jaffe A. Biological variation of galectin-3 and soluble ST2 for chronic heart failure: Implication on interpretation of test results. Am Heart J 2013;165:995–999. DOI: 10.1016/j.ahj.2013.02.029
45. O’Meara E., Prescot M.F., Clagget B. et al. Independent Prognostic Value of Serum Soluble ST2 Measurements in Patients With Heart Failure and a Reduced Ejection Fraction in the PARDIGM-HF Trial (Prospective Comparison of ARNI With ACEI to Determine Impact on Global Mortality and Morbidity in Heart Failure). Circ Heart Fail 2018;11:e004446. DOI: 10.1161/CIRCHEARTFAILURE.117.004446
46. van Vark L.C., Lesman-Leegte I., Baart S.J. et al. Prognostic Value of Serial ST2 Measurements in Patients With Acute Heart Failure. JACC 2017;70(19):2378–88. DOI: 10.1016/j.jacc.201709.026
3rd Cherepkovskaya 15a, Moscow 121552
3rd Cherepkovskaya 15a, Moscow 121552
3rd Cherepkovskaya 15a, Moscow 121552
3rd Cherepkovskaya 15a, Moscow 121552
3rd Cherepkovskaya 15a, Moscow 121552
3rd Cherepkovskaya 15a, Moscow 121552
3rd Cherepkovskaya 15a, Moscow 121552
Protasov V.N., Narusov O.Yu., Skvortsov A.A., Protasova D.E., Kuznetsova T.V., Petrukhina A.A., Masenko V.P., Tereshchenko S.N. Multimarker Approach in Risk Stratification of Patients with Decompensated Heart Failure. Kardiologiia. 2019;59(1S):53-64. (In Russ.) https://doi.org/10.18087/cardio.2637

![]()
office 215, 5, Beregovoy proezd, Moscow, 121087
Publisher: Regional public organization for popularization of scientific and medical literature "Cardiomag". OGRN 1067799014436
tel.: (495) 211–6994
e-mail: info.cardiomag@gmail.com